P-value Explained Simply for Data Scientists

Recently, I got asked about how to explain p-values in simple terms to a layperson. I found that it is hard to do that.
P-Values are always a headache to explain even to someone who knows about them let alone someone who doesn’t understand statistics.
I went to Wikipedia to find something and here is the definition:
In statistical hypothesis testing, the p-value or probability value is, for a given statistical model, the probability that, when the null hypothesis is true, the statistical summary (such as the sample mean difference between two groups) would be equal to, or more extreme than, the actual observed results.
And my first thought was that might be they have written it like this so that nobody could understand it. The problem here lies with a lot of terminology and language that statisticians enjoy to employ.
This post is about explaining p-values in an easy to understand way without all that pretentiousness of statisticians.
A Real-Life problem
In our lives, we certainly believe one thing over another.
From the obvious ones like — The earth is round. Or that the earth revolves around the Sun. The Sun rises in the east.
To the more non-obvious ones with varying level of uncertainties - Exercising reduces weight? Or that Trump is going to win/lose in his next election? Or that a particular drug works? Or that sleeping for 8 hours is good for your health?
While the former category is facts, the latter category differs from person to person.
So, what if I come to you and say that exercising does not affect weight?
All the gym-goers may call me not so kind words. But is there a mathematical and logical structure in which someone can disprove me?
This brings us to the notion of Hypothesis testing.
Hypothesis Testing

So the statement I made in the above example — exercising does not affect weight. This statement is my Hypothesis. Let’s call it Null hypothesisfor now. For now, it is the status quo as in we consider it to be true.
The Alternative Hypothesis from people who swear by exercising is — exercising does reduce weight.
But how do we test these hypotheses? We collect Data. We collect weight loss data for a sample of 10 people who regularly exercise for over 3 months.
WeightLoss Sample Mean = 2 kg
Sample Standard Deviation = 1 kg
Does this prove that exercise does reduce weight? From a cursory look, it sort of looks like that exercising does have its benefits as people who exercise have lost on an average 2 kgs.
But you will find that such clear cut findings are not always the case when you do hypothesis testing. What if the weight loss mean for people who do exercise was just 0.2 kg. Would you still be so sure that exercise does reduce weight?
So how can we quantify this and put some maths behind it all?
Let us set up our experiment to do this.
Experiment
Let’s go back to our Hypotheses again:
Hº: Exercising does not affect weight. Or equivalently 𝜇 = 0
Hᴬ: Exercise does reduce weight. Or equivalently 𝜇>0
We see our data sample of 10 people, and we try to find out the value of
Observed Mean(Weightloss of People who exercise) = 2 kg
Observed Sample Standard Deviation = 1 kg
Now a good question to ask ourselves is — Assuming that the null hypothesis is true, what is the probability of observing a sample mean of 2 kg or more extreme than 2 kg?
Assuming we can calculate this — If this probability value is meagre (lesser than a threshold value), we reject our null hypothesis. And otherwise, we fail to reject our null hypothesis. Why fail to reject and not accept? I will answer this later.
This probability value is actually the p-value. Simply, it is just the probability of observing what we observed or extreme results if we assume our null hypothesis to be true.
The statisticians call the threshold as the significance level(𝜶), and in most of the cases, 𝜶 is taken to be 0.05.
So how do we answer: Assuming that the null hypothesis is true, what is the probability of getting a value of 2 kg or more than 2 kg?
And here comes our favourite distribution, Normal distribution in the picture.
The Normal Distribution
We create a Sampling Distribution of the mean of the WeightLoss samples assuming our Null hypothesis is True.
Central Limit Theorem: The central limit theorem simply states that if you have a population with mean μ and standard deviation σ, and take random samples from the population, then the distribution of the sample means will be approximately normally distributed with mean as the population mean and standard deviation σ/√n. Where σ is the standard deviation of the sample and n is the number of observations in the sample.
Now we already know the mean of our population as given by our null hypothesis. So, we use that and have a normal distribution whose mean is 0. And whose standard deviation is given by 1/√10
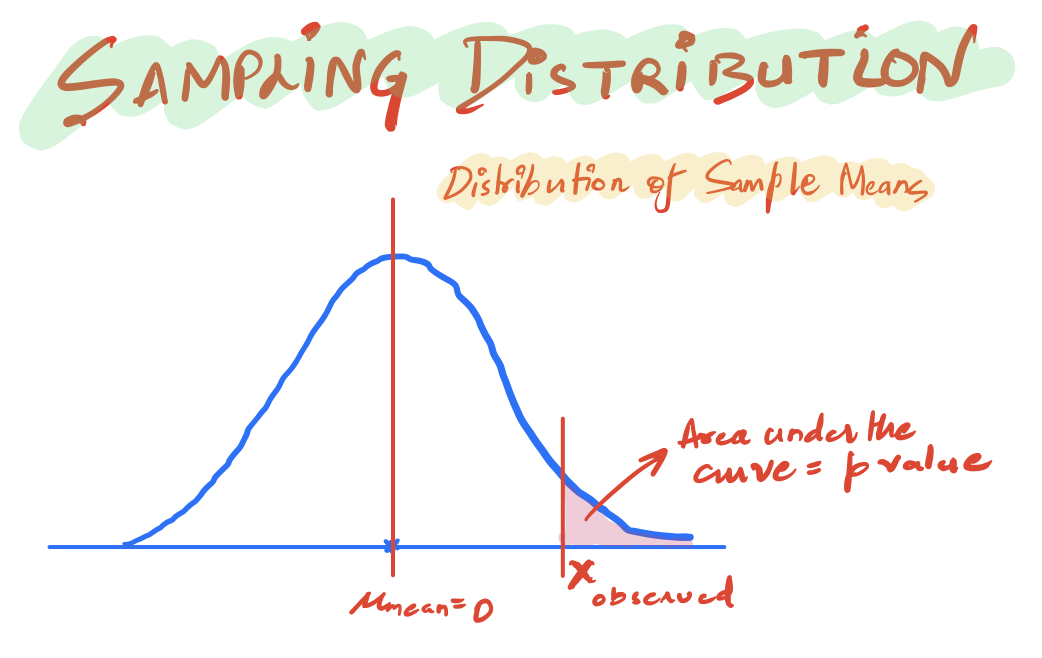
This is, in fact, the distribution of the mean of the samples from the population. We observed a particular value of the mean that is Xobserved = 2 kg.
Now we can use some statistical software to find the area under this particular curve:
from scipy.stats import norm
import numpy as np

p = 1-norm.cdf(2, loc=0, scale = 1/np.sqrt(10))
print(p)
1.269814253745949e-10
As such, this is a very small probability p-value ( less than the significance level of 0.05) for the mean of a sample to take a value of 2 or more.
And so we can reject our Null hypothesis. And we can call our results statistically significant as in they don’t just occur due to mere chance.
The Z statistic
You might have heard about the Z statistic too when you have read about Hypothesis testing. Again as I said, terminology.
That is the extension of basically the same above idea where we use a standard normal with mean 0 and variance 1 as our sampling distribution after transforming our observed value x using:
This makes it easier to use statistical tables. In our running example, our z statistic is:
z = (2-0)/(1/np.sqrt(10))
print(z)
6.324555320336758
Just looking at the Z statistic of >6 should give you an idea that the observed value is at least six standard deviations away and so the p-value should be very less. We can still find the p-value using:
from scipy.stats import norm
import numpy as np

p = 1-norm.cdf(z, loc=0, scale=1)
print(p)
1.269814253745949e-10
As you can see, we get the same answer using the Z statistic.
An Important Distinction

So we said before that we reject our null hypothesis as in we got sufficient evidence to prove that our null hypothesis is false.
But what if the p-value was higher than the significance level. Then we say that we fail to reject the null hypothesis. Why don’t we say accept the null hypothesis?
The best intuitive example of this is using trial courts. In a trial court, the null hypothesis is that the accused is not guilty. Then we see some evidence to disprove the null hypothesis.
If we are not able to disprove the null hypotheses the judge doesn’t say that the accused hasn’t committed the crime. The judge only says that based on the given evidence, we are not able to convict the accused.
Another example to drive this point forward: Assuming that we are exploring life on an alien planet. And our null hypothesis(Hº) is that there is no life on the planet. We roam around a few miles for some time and look for people/aliens on that planet. If we see any alien, we can reject the null hypothesis in favour of the alternative.
But if we don’t see any alien, can we definitively say that there is no alien life on the planet or accept our null hypotheses? Maybe we needed to explore more, or perhaps we needed more time and we may have found an alien. So, in this case, we cannot accept the null hypothesis; we can only fail to reject it. Or In Cassie Kozyrkov’s words from whom the example comes, we can say that “we learned nothing interesting”.
In STAT101 class, they teach you to write a convoluted paragraph when that happens. (“We fail to reject the null hypothesis and conclude that there is insufficient statistical evidence to support the existence of alien life on this planet.”) I’m convinced that the only purpose of this expression is to strain students’ wrists. I’ve always allowed my undergraduate students to write it like it is: we learned nothing interesting.

In essence, hypothesis testing is just about checking if our observed values make the null hypothesis look ridiculous. If yes, we reject the null hypothesis and call our results statistically significant. And otherwise we have learned nothing interesting, and we continue with our status quo.
Continue Learning
If you want to learn more about hypothesis testing, confidence intervals, and statistical inference methods for numerical and categorical data, Mine Çetinkaya-Rundel teaches Inferential Statistics course on coursera and it cannot get simpler than this one. She is a great instructor and explains the fundamentals of Statistical inference nicely.
Thanks for the read. I am going to be writing more beginner-friendly posts in the future too. Follow me up at <strong>Medium</strong> or Subscribe to my <strong>blog</strong>
Also, a small disclaimer — There might be some affiliate links in this post to relevant resources as sharing knowledge is never a bad idea.
About Me

I’m a Machine Learning Engineer based in London, where I am currently working with Roku .
Know More