Automate Hyperparameter Tuning for your models

When we create our machine learning models, a common task that falls on us is how to tune them.
People end up taking different manual approaches. Some of them work, and some don’t, and a lot of time is spent in anticipation and running the code again and again.
So that brings us to the quintessential question: Can we automate this process?
A while back, I was working on an in-class competition from the <strong>“How to win a data science competition”</strong> Coursera course. Learned a lot of new things, one among them being Hyperopt — A bayesian Parameter Tuning Framework.
And I was amazed. I left my Mac with hyperopt in the night. And in the morning I had my results. It was awesome, and I did avoid a lot of hit and trial.
This post is about automating hyperparameter tuning because our time is more important than the machine.
So, What is Hyperopt?

From the Hyperopt site:
Hyperopt is a Python library for serial and parallel optimization over awkward search spaces, which may include real-valued, discrete, and conditional dimensions
In simple terms, this means that we get an optimizer that could minimize/maximize any function for us. For example, we can use this to minimize the log loss or maximize accuracy.
All of us know how grid search or random-grid search works.
A grid search goes through the parameters one by one, while a random search goes through the parameters randomly.
Hyperopt takes as an input space of hyperparameters in which it will search and moves according to the result of past trials.
Thus, Hyperopt aims to search the parameter space in an informed way.
I won’t go in the details. But if you want to know more about how it works, take a look at this <strong>paper</strong> by J Bergstra. Here is the <strong>documentation</strong> from Github.
Our Dataset
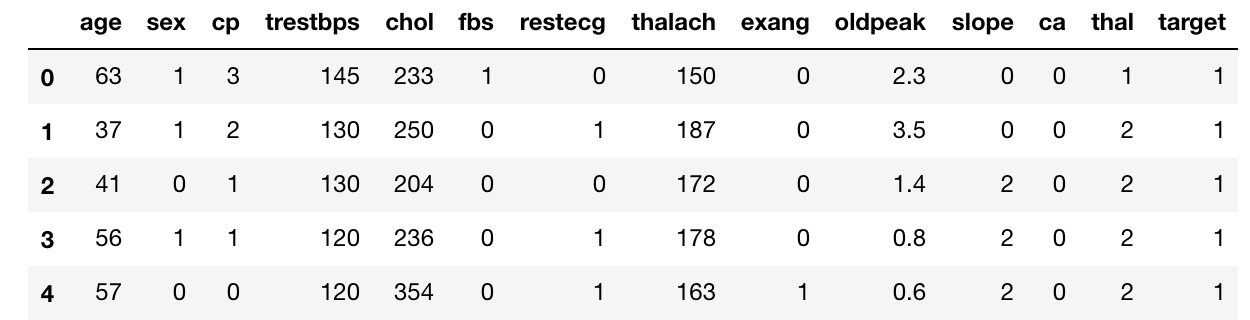
To explain how hyperopt works, I will be working on the heart dataset from UCI precisely because it is a simple dataset. And why not do some good using Data Science apart from just generating profits?
This dataset predicts the presence of a heart disease given some variables.
This is a snapshot of the dataset :
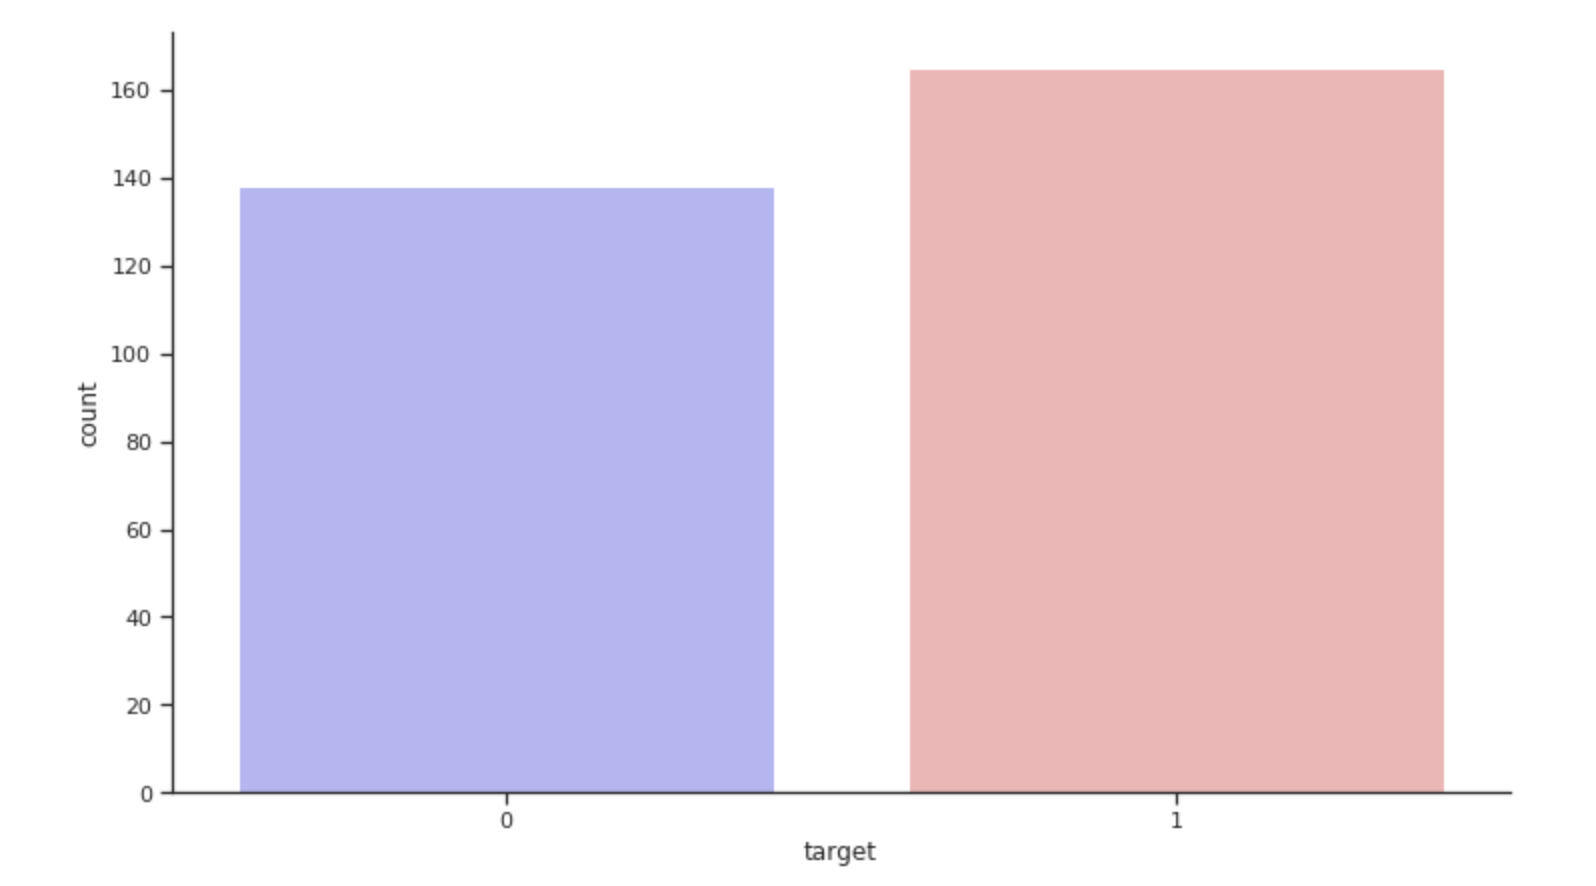
This is how the target distribution looks like:
Hyperopt Step by Step

So, while trying to run hyperopt, we will need to create two Python objects:
An Objective function: The objective function takes the hyperparameter space as the input and returns the loss. Here we call our objective function
objectiveA dictionary of hyperparams: We will define a hyperparam space by using the variable
spacewhich is actually just a dictionary. We could choose different distributions for different hyperparameter values.
In the end, we will use the fmin function from the hyperopt package to minimize our objective through the space.
You can follow along with the code in this Kaggle Kernel .
1. Create the objective function
Here we create an objective function which takes as input a hyperparameter space:
We first define a classifier, in this case, XGBoost. Just try to see how we access the parameters from the space. For example
space[‘max_depth’]We fit the classifier to the train data and then predict on the cross-validation set.
We calculate the required metric we want to maximize or minimize.
Since we only minimize using
fminin hyperopt, if we want to minimizeloglosswe just send our metric as is. If we want to maximize accuracy we will try to minimize-accuracy
from sklearn.metrics import accuracy_score
from hyperopt import hp, fmin, tpe, STATUS_OK, Trials
import numpy as np
import xgboost as xgb
def objective(space):
    # Instantiate the classifier
    clf = xgb.XGBClassifier(n_estimators =1000,colsample_bytree=space['colsample_bytree'],
                           learning_rate = .3,
                            max_depth = int(space['max_depth']),
                            min_child_weight = space['min_child_weight'],
                            subsample = space['subsample'],
                           gamma = space['gamma'],
                           reg_lambda = space['reg_lambda'])

    eval_set  = [( X, y), ( Xcv, ycv)]

    # Fit the classsifier
    clf.fit(X, y,
            eval_set=eval_set, eval_metric="rmse",
            early_stopping_rounds=10,verbose=False)

    # Predict on Cross Validation data
    pred = clf.predict(Xcv)

    # Calculate our Metric - accuracy
    accuracy = accuracy_score(ycv, pred>0.5)
# return needs to be in this below format. We use negative of accuracy since we want to maximize it.
    return {'loss': -accuracy, 'status': STATUS_OK }
2. Create the Space for your classifier

Now, we create the search space for hyperparameters for our classifier.
To do this, we end up using many of hyperopt built-in functions which define various distributions.
As you can see in the code below, we use uniform distribution between 0.7 and 1 for our subsample hyperparameter. We also give a label for the subsample parameter x_subsample. You need to provide different labels for each hyperparam you define. I generally add a x_ before my parameter name to create this label.
space ={'max_depth': hp.quniform("x_max_depth", 4, 16, 1),
        'min_child_weight': hp.quniform ('x_min_child', 1, 10, 1),
        'subsample': hp.uniform ('x_subsample', 0.7, 1),
        'gamma' : hp.uniform ('x_gamma', 0.1,0.5),
        'colsample_bytree' : hp.uniform ('x_colsample_bytree', 0.7,1),
        'reg_lambda' : hp.uniform ('x_reg_lambda', 0,1)
    }
You can also define a lot of other distributions too. Some of the most useful stochastic expressions currently recognized by hyperopt’s optimization algorithms are:
hp.choice(label, options)— Returns one of the options, which should be a list or tuple.hp.randint(label, upper)— Returns a random integer in the range [0, upper).hp.uniform(label, low, high)— Returns a value uniformly between low and high.hp.quniform(label, low, high, q)— Returns a value like round(uniform(low, high) / q) * qhp.normal(label, mu, sigma)— Returns a real value that’s normally-distributed with mean mu and standard deviation sigma.
There are a lot of other distributions. You can check them out here .
3. And finally, Run Hyperopt

Once we run this, we get the best parameters for our model. Turns out we achieved an accuracy of 90% by just doing this on the problem.
trials = Trials()
best = fmin(fn=objective,
            space=space,
            algo=tpe.suggest,
            max_evals=10,
            trials=trials)
print(best)
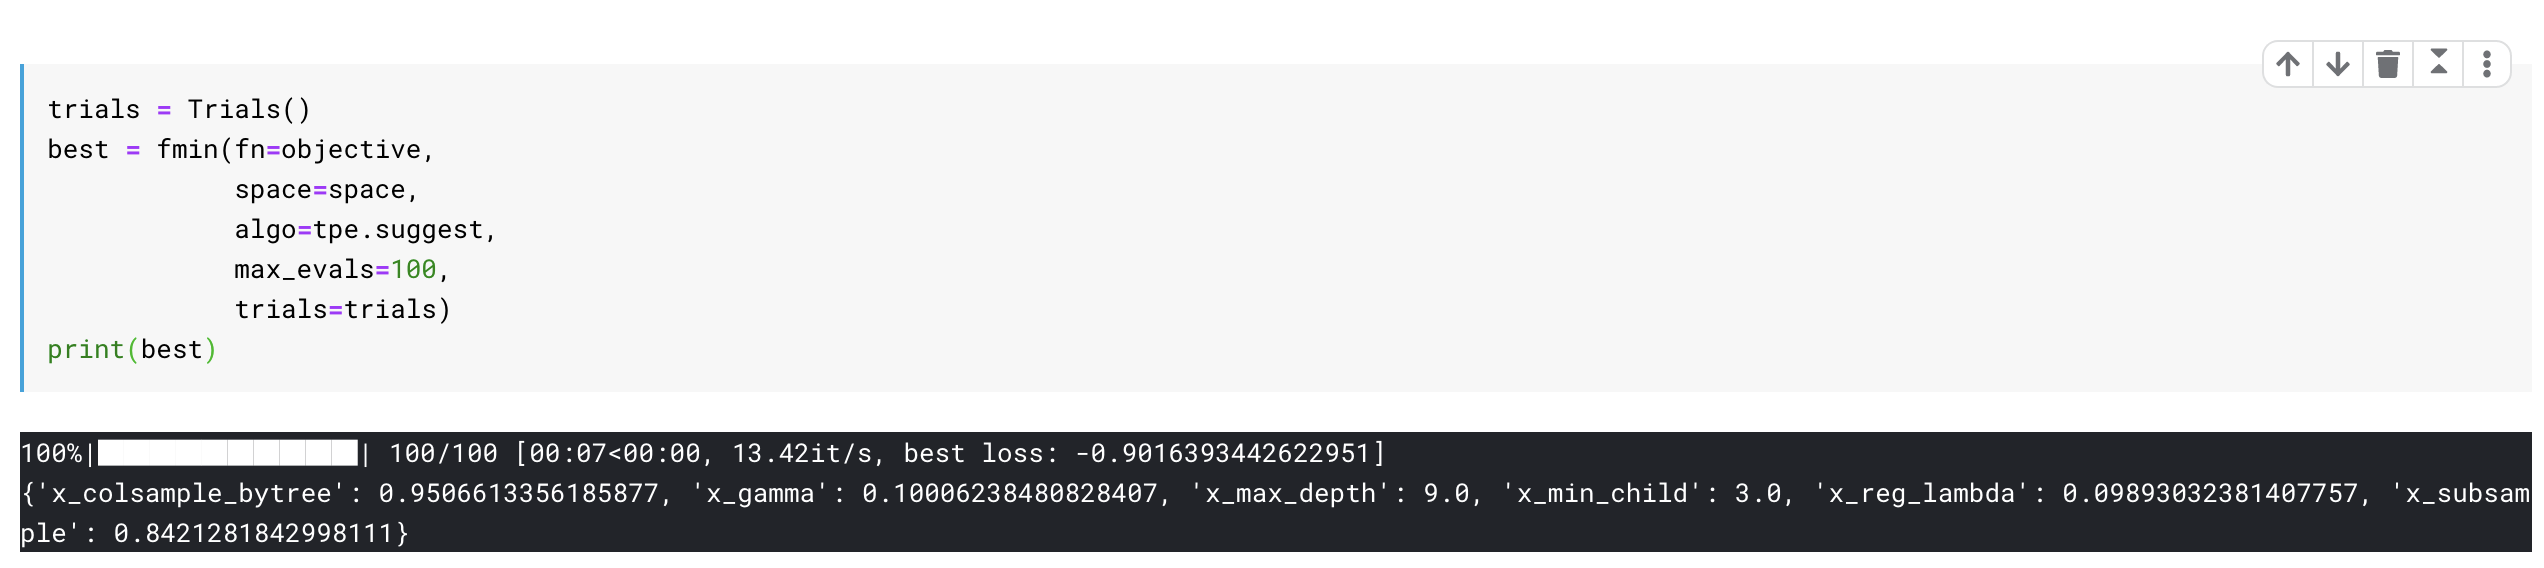
Now we can retrain our XGboost algorithm with these best params, and we are done.
Conclusion
Running the above gives us pretty good hyperparams for our learning algorithm. And that saves me a lot of time to think about various other hypotheses and testing them.
I tend to use this a lot while tuning my models. From my experience, the most crucial part in this whole procedure is setting up the hyperparameter space, and that comes by experience as well as knowledge about the models.
So, Hyperopt is an awesome tool to have in your repository but never neglect to understand what your models does. It will be very helpful in the long run.
You can get the full code in this Kaggle Kernel .
Continue Learning
Also, if you want to learn about Spark and Spark DataFrames, I would like to call out an excellent course on Big Data Essentials: HDFS, MapReduce and Spark RDD on Coursera.
There is also another framework called as Optuna that you could use as a substitute to Hyperopt. Read about it here .
Thanks for the read. I am going to be writing more beginner-friendly posts in the future too. Follow me up at Medium or Subscribe to my blog .
Also, a small disclaimer - There might be some affiliate links in this post to relevant resources as sharing knowledge is never a bad idea.
About Me

I’m a Machine Learning Engineer based in London, where I am currently working with Roku .
Know More